As I get more familiar with iOS, one difference from my experience with consoles is the general mystery about where resources end up in memory.
For consoles a typical game allocates as much memory as it can from the OS, puts it into its own memory pools and then is as miserly as possible from then on.
On iOS, even figuring out how much memory you’re using is pretty difficult! There’s not too much information available at runtime, and it’s a bit off-putting when I count up the allocations my game has made, and the system reports that it is using 400% more than I expected. Ouch. The documentation seems a bit scattered, so most of this post is me documenting my discoveries as I go. I’m certainly not an expert here, so take all of it with a few grains of salt.
If you google for information about memory on iOS, the first recommendation is to look at the Allocations instrument. This is generally good advice.
Allocations

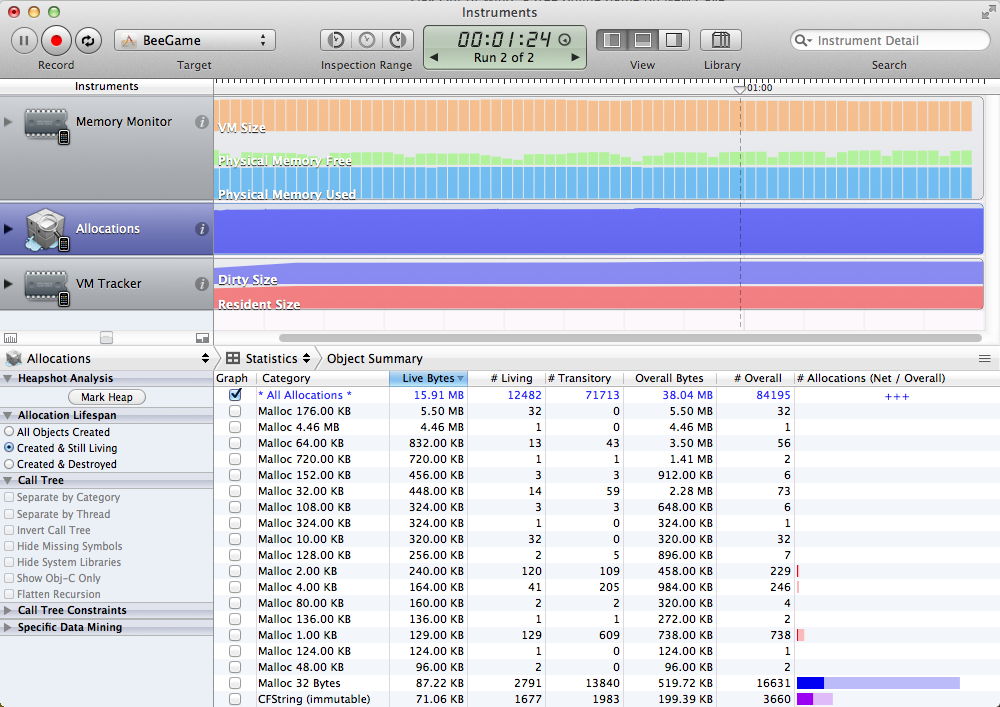
The allocations will show you in a reasonably nice way all of the calls your application makes to malloc. If you’re using C++ or Objective-C, calls to new or alloc end up falling through to… malloc! So any standard code side allocations will show up here with a callstack to help you track it down, which is pretty handy. As a reference in my game if I disable my internal allocator, this shows a pretty stable usage of around 16 MB over 12 thousand allocations.
But wait… where are my textures? I know I’m using some memory for my textures and buffer objects. And they are nowhere to be found. And if I swap in TCMalloc or dlmalloc as my allocator, all of a sudden I’m only using 4.3 MB. And if you’re using MonoTouch or Unity, you might get suspicious about not seeing the C# heap memory being taken into account. So off to other instruments we go!
Memory Monitor
The number that’s usually the most off-putting is the one reported by the Memory Monitor instrument under the Real Memory column. This seems to include EVERYTHING! Textures, executable, shared libraries, actual allocations. You name it, it’s yours and counted against you. Of course it’s pretty much impossible to figure out what’s using it from just the one number… but it’s a start. A side note is that this number is the same as what this call returns:
kern_return_t kerr = task_info(mach_task_self(), TASK_BASIC_INFO, (task_info_t)&info, &size);
So it is available at runtime at least. That number also tends to match the number reported in out of memory crash reports, indeed if you dig around Mach you’ll see the number reported is the number of pages multiplied by the page size. One fun thing about the memory monitor is you can see other applications and how much memory they’re using. The biggest one I’ve found so far is Infinity Blade by Epic, which peaked in at a hefty 165 MB of memory, or around 1/4 of the available memory on my iPhone 4. My game when running pokes in at 28.62 MB, which we’ll note is significantly higher than the 15 MB that Allocations reported.
VM Tracker
 Next down the list is the number reported by the VM Tracker (Virtual Memory Tracker) instrument. Things get interesting with VM Tracker, as it looks to be the most finely grained method for iOS to report an application’s memory usage.
In my game we can see that it has a *Resident* size of 97.69 MB, and a *Dirty* size of 36.43 MB. The *Resident* size is presumably all of the memory/pages that the system associates with my App. It is close to 3x what the Memory Monitor reports! So clearly the Memory Monitor is not assigning the blame for all of that memory to my game. The *Dirty* size is also bigger than what Memory Monitor reports, but it’s at least a little bit closer to what’s expected. From reading through the Apple developer forums it looks like “Dirty memory usage is the most important on iOS, as this represents memory that cannot be automatically discarded by the VM system (because there is no page file).” So let’s go through the categories I’m aware of:
IOKit
IOKit is… textures you’ve uploaded with OpenGL, i.e. all those calls to glTexImage2d. If you’re not using OpenGL, your image resources will likely go into a different label, “Core Animation” and “CGImage” come up, but don’t quote me on it.
VM_ALLOCATE
The VM_ALLOCATE label is a bit of a grab bag. I set a breakpoint on the call to vm_allocate() and noticed that my glBufferData calls are in the callstack, so VBOs allocate their memory from this region, (not all vertex arrays will end up in here though, some also end up hitting malloc!). In fact it seems like anything that uses mmap will also show up in here, presumably because mmap calls generate vm_allocate() under the hood. If you’re using dlmalloc, it will use mmap by default, so dlmalloc’s heap is actually accounted for in this label and not included in the malloc sections. Likewise it seems mono uses this for its memory, so if you have a Unity game and are wondering where the rest of the heap is… VM_ALLOCATE is your culprit!
SBRK
If you see an sbrk region, it means you are using software designed for systems that expect the sbrk() to do something reasonable. iOS (and OS X!) are not those platforms. They just get the lovely call found here, which shows it calling vm_allocate under the hood and with a hardcoded 4 MB. Oof. If you’re using TCMalloc make sure you modify the config.h to not use sbrk, as the autoconfig will find the header and assume it’s a good idea to use it.
__TEXT
The __TEXT section is using quite a bit of memory in my example: 584 KB for the application itself, and 27.21 MB total! As one might fear, unfortunately a big chunk of this is outside my control. __TEXT contains your actual executable code, as well as other things marked read only, like literal strings and other constant data. It also contains those sections for any dynamic libraries in use by running applications, so even if you cut down on the libraries you’re using, there’s no guarantee your __TEXT section will shrink. What is under your control is the size of your executable, including constant data, as well as the libraries you use/load, although the latter may not be much help.
__DATA
The __DATA section contains static sections of your executable that are writable. So those big global buffers you shouldn’t be using will show up here. If you look at the map file for your executable, you can see which parts of the __DATA section in particular are taking up space. The bss would be your application’s static data. If you’re unfamiliar with what that that might mean, in C/ObjC/C++ it’s typically made of the following:
- Non-const variables that are declared static in your classes or functions.
- Global variables.
You can read in more detail here what the executable sections mean, including our __DATA section and __TEXT section friends.
MALLOC_TINY, MALLOC_SMALL, MALLOC_LARGE
Then we get to the malloc regions. There are three of them, and their sum will be the closest number to what Allocations reports: all our ‘standard’ allocations will end up somewhere in one of these three pools. From this division, and by browsing through the Libc code, we can see that the mach allocator is partially inspired by Hoard, and has some small thread caching behaviour to help threaded applications.
Assuming the iOS malloc is using that source file, we can see that ‘MALLOC_TINY’ means up to 496 bytes, ‘MALLOC_SMALL’ means up to 15 KB, and ‘MALLOC_LARGE’ for everything bigger than that. I did some quick tests with iOS 5.1 and can confirm those sizes make sense. Leaking 400 bytes goes to tiny, 600 bytes go to small, and 16000 bytes end up in large. It seems to be a generally spiffy allocator actually, so carefully consider the downsides of using your own!
A useful rundown of OS X’s allocator (which seems to be the same!) tells us there used to be a ‘huge’ malloc, but it was removed when Snow Leopard hit, somewhere around iOS 4. Besides the standard debug calls available in malloc.h, there’s a useful undocumented function called scalable_zone_statistics and it can work well for getting statistics about how you’re hitting the different malloc sections at runtime, I use it like so:
extern "C" boolean_t scalable_zone_statistics(malloc_zone_t *zone, malloc_statistics_t *stats, unsigned subzone);
malloc_statistics_t stats;
scalable_zone_statistics(malloc_default_zone(), &stats, 0); //or 1 or 2 for the small/large
As it’s not public, I would recommend against using it in anything you hope to release.
Miscellaneous
TCMalloc – this seems to be WebKit using TC Malloc internally. Not using webkit you say? Neither am I. Seems to top out around 250 KB for me.
Memory Tag 70 – This wonderfully named section seems to be related to UIImage or other UIKit calls. For me it’s only 32 KB, but I’ve seen some apps report much higher usage. Make sure you’re loading your images with UIImage with the correct method!
LINKEDIT – The ‘link edit’ (I always read it first as Linked-It…) is for the dynamic linker to patch up calls to dynamic libraries. I think. Most of this will be in under the dyld_shared_cache, which presumably means it’s for shared libraries.
WAT?
I’ll keep updating this post as I learn more about how things work on iOS, but hopefully this will be useful to other people who start to wonder where all that memory is going. If I have anything wrong or there’s things that should be added here, please let me know!


